
This guide walks through the EasyDMARC platform section by section, starting with adding and verifying your first domain.
Table of contents:
- Initial steps to get set up with EasyDMARC
- Dashboards
- Domains
- DNS Manager
- DMARC
- Sender Insights
- Monitoring
- Tools
Initial steps to get set up with EasyDMARC
Adding your domain to the platform is the first step in monitoring and analyzing your email authentication setup. By connecting your domain, you can track DMARC reports, identify potential issues, and improve email deliverability. In this guide, we'll walk you through the process to ensure a smooth setup.
Once your account is created, you will reach a page where the platform will ask you to add your domain, as shown in the screenshot below. 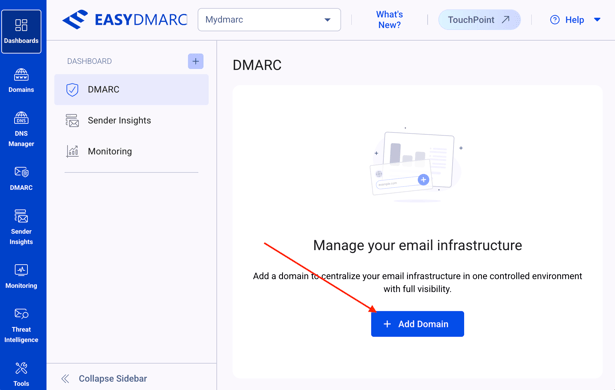
Now, the platform will provide you with two options:
1. Add the domain(s) discovered via integrations to add a domain
This option automatically discovers domains from your connected integrations, including DNS providers and ESPs, saving you the effort of adding and configuring each one by hand.
Because the connections stay active, any future domains or changes are picked up automatically too, not just on this first pass. The Add Domain button's badge count reflects what's currently waiting to be added.
Note: If your DNS integration is connected, the domain can be added and verified this way automatically, with no manual DNS work on your part.
Please find the list of available DNS integrations at this link.
2. Manual option to add the domain.
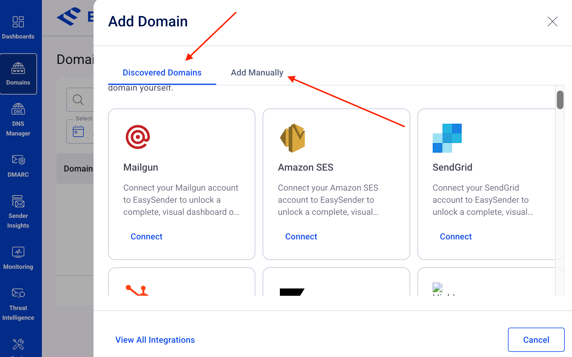
In this guide, we will go with the manual option, where you need to add the domain by mentioning the two important points:
1. The workspace (previously "domain group") where you want to add it.
Workspaces let you group your domains for easier organization and access control — for example, separating active sending domains from parked ones, or setting up one workspace per client if you manage multiple organizations. You can move domains between workspaces at any time, so this isn't a one-way decision.
2. The type of domain - sending/active or parked/inactive.
The number of sending domains you can have depends on the plan you purchase. However, you can have unlimited parked domains on your account.
Note: While parked domains are not used to send emails, you need to make sure that your parked domains are also properly protected against spoofing.
Visit this link for detailed steps on how to set up SPF, DKIM, and DMARC for parked domains.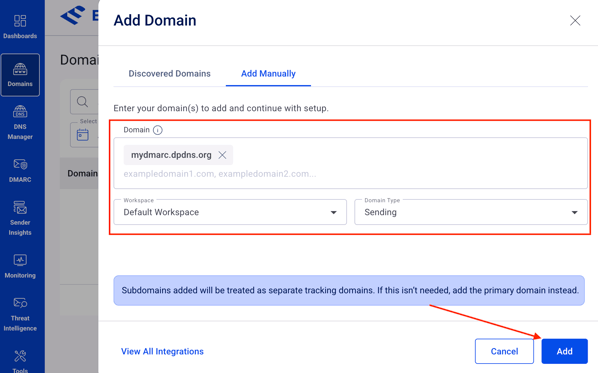
Once the domain is added, you need to verify it. In this step as well, the platform will provide you with two options to add a DMARC record with our RUA and RUF tags. This is a very important step required to start receiving and monitoring DMARC reports in EasyDMARC.
Option 1:Adding a DMARC record using our Managed DMARC. This is a DMARC record with a CNAME type, meaning that once you choose this option, which is strongly recommended, you will be able to manage your DMARC record directly from EasyDMARC rather than the DNS zone. It is a one-time change, and after that, all DMARC management will be done from EasyDMARC.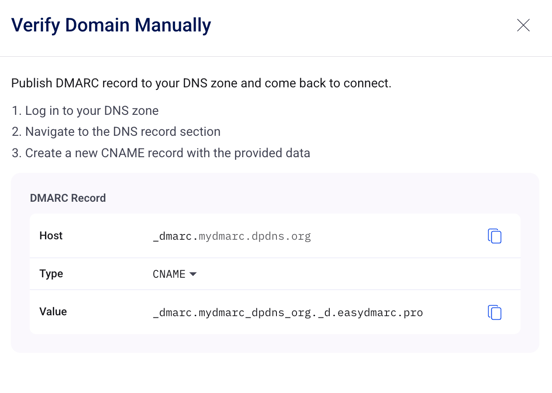
In case you choose this option, follow the steps below to add the record to your DNS.
Important note: If you have an existing DMARC record, make sure to remove it before adding the new one provided by EasyDMARC.
We’re using Cloudflare as an example.
As shown in the screenshot below, this is how the record should look in the DNS zone.
If your DNS zone is also with Cloudflare, like mine, make sure to toggle off the proxy.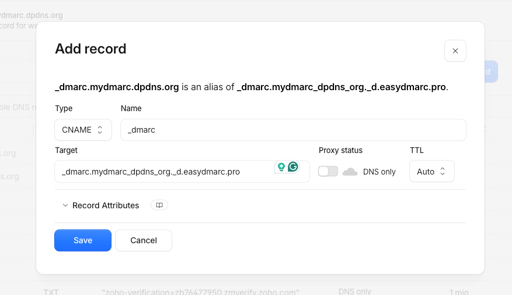
After adding the record, click the verify button.
Please note that DNS propagation may take some time.
Once the record has propagated, you will see the success status in green.
Option 2: Verifying the domain with a TXT record to manage it directly in the DNS. This is mainly known as a manual record since it is a TXT record. If you choose this option, any future DMARC record changes can only be made manually from the DNS zone.
Change the record type from CNAME to TXT to obtain the TXT-type DMARC record.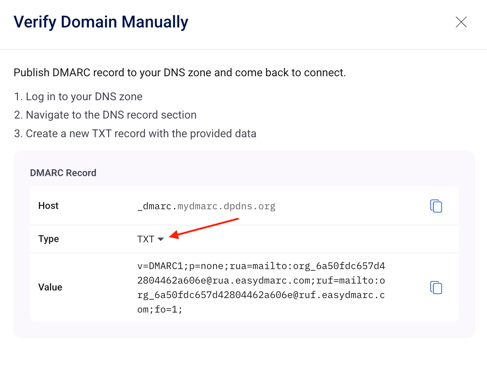
Important note: If you have an existing DMARC record, make sure to remove it before adding the new one provided by EasyDMARC.
I'm using Cloudflare as an example.
As shown in the screenshot below, this is how the record should look in the DNS zone.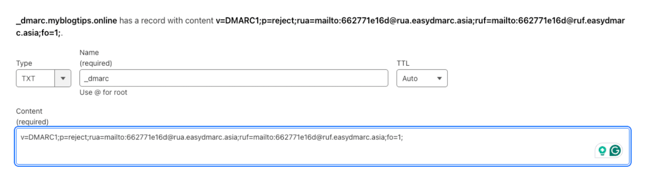
After adding the record, click the "Verify" button
Please note that DNS propagation may take some time.
Once the record has propagated, you will again see the success message in green.
Once you have added the domain and verified it, EasyDMARC reporting will be active, and you will be able to receive your domain's DMARC reports in the EasyDMARC dashboard.
Please note that after verifying the domain, the first DMARC aggregate reports will be visible in the EasyDMARC dashboard within 72 hours. This initial delay only applies to the very first reports. Once those first reports show up, the data will be updated consistently every 24 hours moving forward.
Note: If no DMARC policy has been configured previously, begin the the DMARC project with the policy as “p=none”, per best practices.
This is also known as the monitoring mode, which will allow you to receive your domain’s DMARC reports, analyze them, and go over the configurations accordingly. In the meantime, you will make sure that your legitimate emails are not getting quarantined or rejected because of the DMARC policy.
Here is what it should look like when using a TXT-type DMARC record: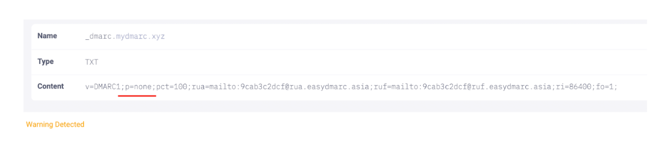
And here the setup of the “p=none” policy when you have activated the Managed DMARC solution for your domain: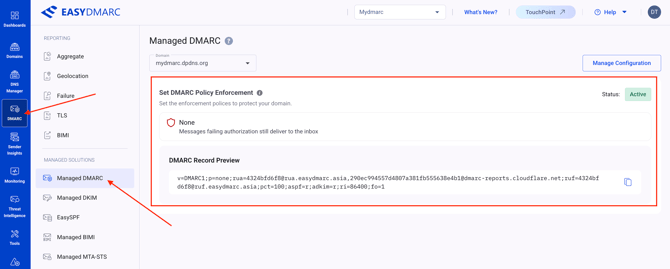
Your domain is now added and verified — from here, the rest of this guide walks through each section of the platform on its own, so you can go directly to what's relevant to your setup.
Dashboards
Dashboards is the first section in the platform with three subsections - DMARC, Sender Insights, and Monitoring.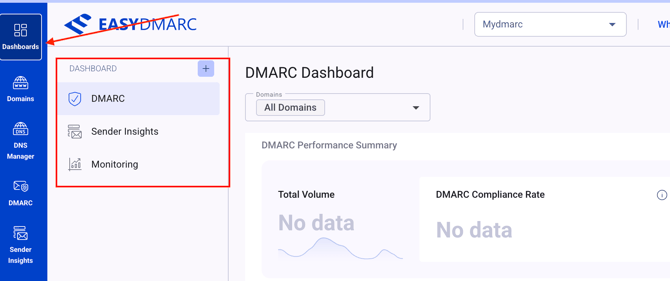
The DMARC dashboard provides a holistic overview of your domains, records, and reports, summarizing key insights for a quick glance at your practices.
The DMARC dashboard consists of:
1. The dropdown selection box where you can select all domains at once or select any specific domain(domains) to check.
2. The time customization table to specify which timeframe you want to see information for
3. Brief summary of your DMARC performance which shows the total volume of emails you sent, the DMARC compliance rate (percentage of your emails that passed DMARC checks) and the DMARC enforcement rate.
4. DMARC policy distribution which shows counts of domains with "p=none", "p=quarantine" and "p=reject" DMARC policies.
5. The statuses of your domains' DNS records (SPF, DKIM, DMARC and BIMI).
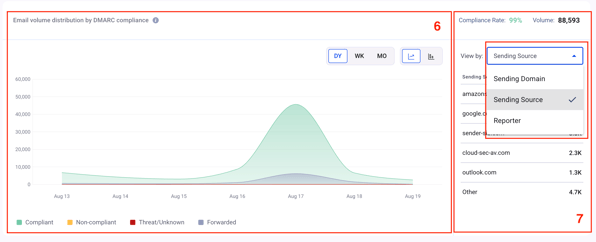
6. Email volume distribution by DMARC compliance - you can visualize your DMARC aggregate reports by days, weeks and months
7. Top volume contributors, where you can see the top volumes filtered by Sending domains, sending sources or the DMARC reporters
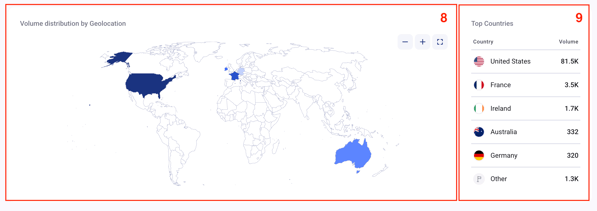
8. Volume distribution by geolocation which shows the map view of IP addresses which were used to send out your emails.
9. Top countries where you have sent your emails to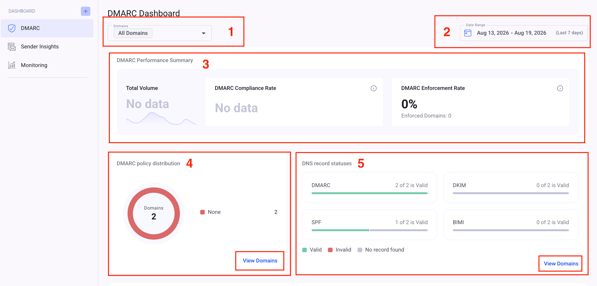
The Sender Insights dashboard will show you how your emails perform after sending — delivery rates, engagement, and reputation health across your connected sending platforms.
Sender insights dashboard shows:
1. The overall sending performance summary by total volume of sent emails, the delivery and bounce rates
2. The table showing your sending insights based on the data from sources that you have connected to the platform
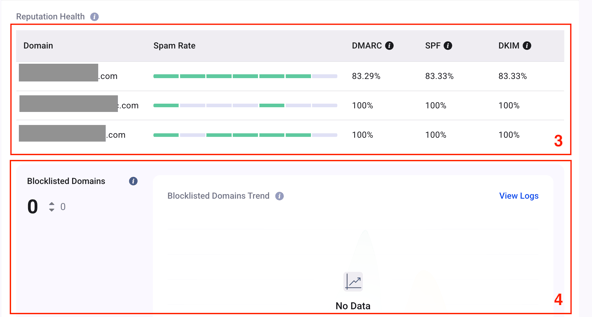
3. Reputation health metrics, which show the domain's spam rate and the DMARC, SPF and DKIM pass rates by percentage.
4. The information about any domains in your account that might have been blocklisted with the option to view the logs in detail
Note: You need to create Mailbox Provider or Email sending provider connectors to receive data in sender insights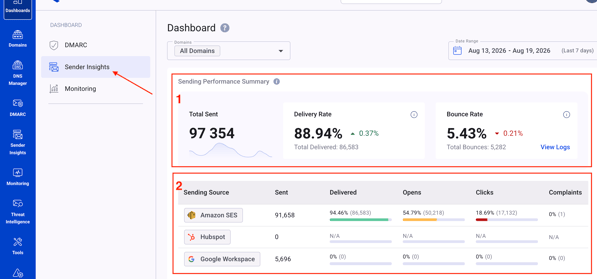
The third type of the dashboards is the Monitoring dashboard.
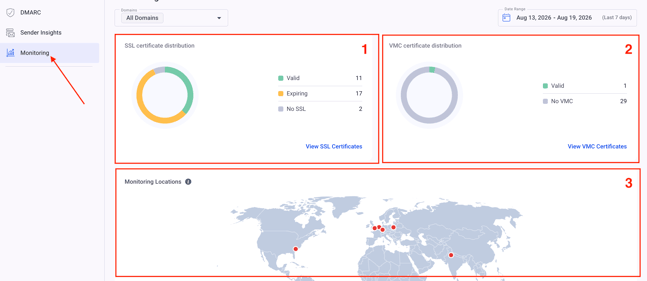
The Monitoring dashboard is for tracking the health of your domains' infrastructure — SSL certificate status, VMC (Verified Mark Certificate) status, and uptime across all your monitored domains.
In this dashboard you will find:
- SSL certificate distribution, showing how many of your domains have valid, expiring, or missing SSL certificates
- VMC certificate distribution, showing how many of your domains have a valid Verified Mark Certificate versus none
- A map of monitoring locations, showing the geographic probe points your domains are checked from
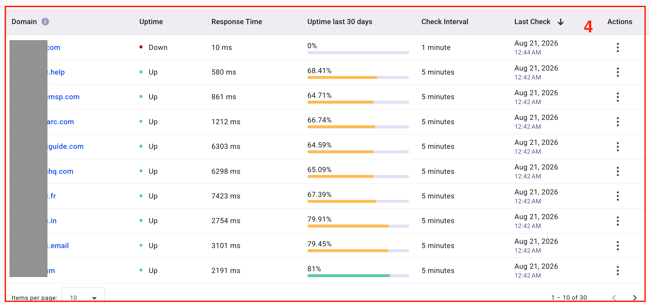
- An uptime table listing each monitored domain's current status, response time, 30-day uptime percentage, check interval, and last check time
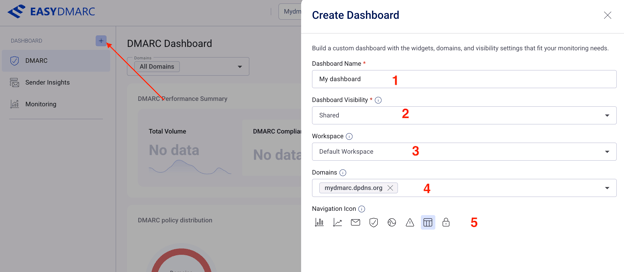
In addition to the three built-in dashboards, you can also create your own custom dashboard. Clicking the "+" button next to the dashboard list opens the Create Dashboard window, where you can set:
- Dashboard Name — the name that will appear in your dashboard list
- Dashboard Visibility — use Personal for your own working views, and shared when you want a dashboard other teammates or clients can see too.
- Workspace — only shown when Visibility is set to Shared; this ties the dashboard to one workspace and limits the Domains selection to that workspace's domains
- Domains — select which domains this dashboard should include; with Personal, all your domains are selected by default, while with Shared, you'll need to pick them after choosing a workspace
- Navigation Icon — pick an icon to help you visually tell your custom dashboards apart in the list
Once the custom dashboard is created, you can construct it by adding any widgets that you'd like based on the data you want to monitor in the custom dashboard: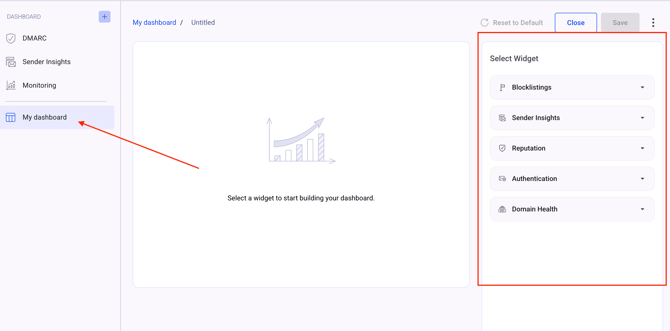
Domains
The Domains section is where you manage your actual domain inventory — this is where you add new domains, organize them into workspaces, and take action on them, like fixing DNS records or changing settings. While the dashboards give you an overview of how things stand, the Domains section is where you go to actually make changes.
In this section, you will find:
- A search bar to quickly find a specific domain by name
- A Workspaces filter to narrow the list down to one or more workspaces
- A Filter tool to build more specific conditions, like domains starting with a certain prefix or added after a certain date
- A Group By option to organize domains by workspace, DMARC policy, or type
- A date range picker that controls the time window for volume and performance columns
- An Add Domain button for adding new domains, either automatically discovered or manually entered
- The domains table itself, showing each domain's workspace, verification status, policy, volume, compliance rate, and other details you can customize
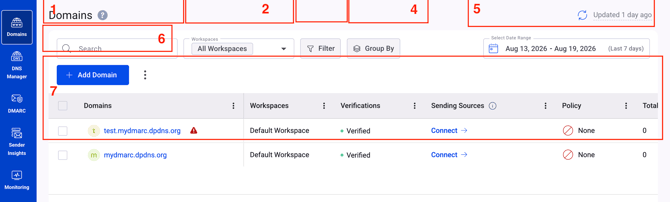
You can also customize the visible columns to display additional statuses based on your requirements.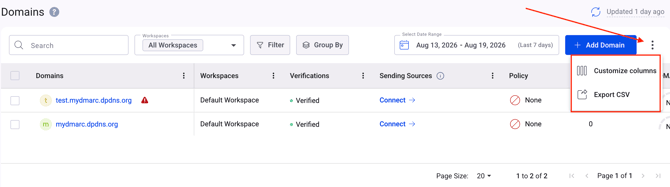
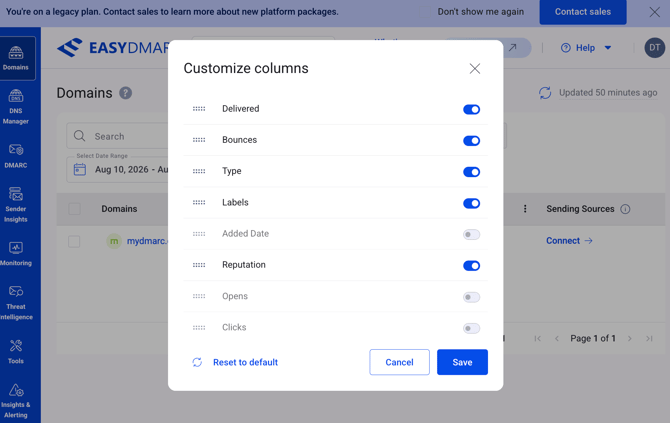
To open the advanced domain management section, simply click on the domain, after which you'll be redirected to the general domain management section, consisting of three subsections.
First subsection is the Overview. The overview section will provide the following information:
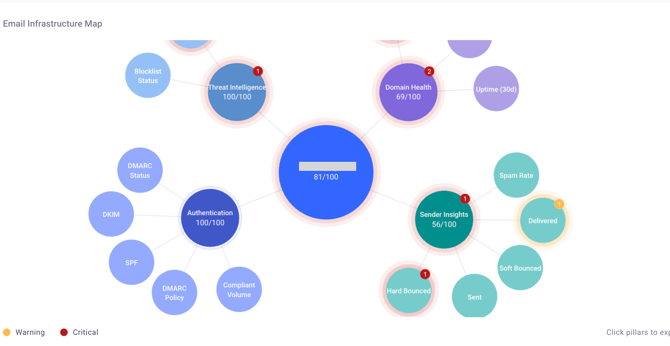
1. Domain infrastructure map, which consists of 4 main pillars - threat intelligence, domain health, authentication, and sender insights - and the domain's infrastructure health score based on those 4 pillars. Each of those pillars extends to a more detailed view when clicked on: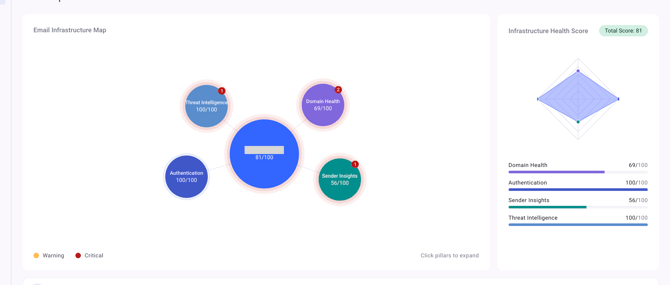
2. Widgets of DNS insights, Authentication, and Threat intelligence pillars, which provide summarized information about the performance of each pillar. There is also the option to extend and view the details of each widget's data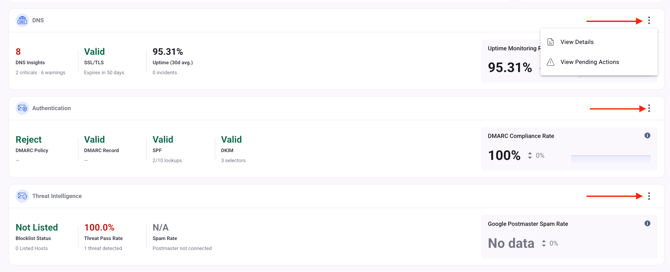
3. Email delivery funnel with the sending ecosystem breakdown, details of which you can observe by clicking the "view details" button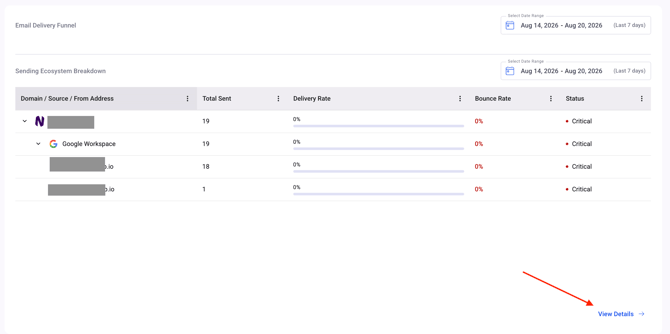
The next subsection of the section "Domains" is "Pending actions" with different criteria and severity levels for each domain.
You can navigate to the pending actions list for a domain also by clicking on the red triangle sign next to the domain.
These pending actions help you take full advantage of EasyDMARC’s features and resolve any issues related to your configurations.
In this section, you will find:
1. The dropdown to select any of your domains and see its pending actions
2. The pending actions count per severity, which can be:
Critical: Actions that block email authentication or visibility and should be resolved first (e.g., fix invalid DNS records)
Warning: Actions that weaken your configuration but do not stop email from being authenticated.
Informative: Optional improvements that make managing this domain easier.
3. The extended view of the pending actions with the buttons redirecting to fixing the issues or making improvements, as well as dismissing the actions. However, please note that critical actions can't be dismissed. 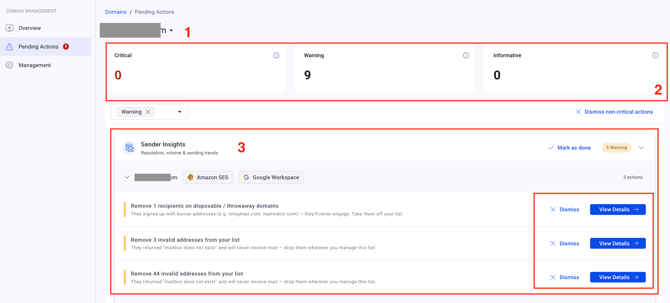
The “Management” tab represents such details as:
1. The domain type - sending or parked
2. The workspace
3. The domain’s label. You can label the domains for ease of management. Labels don't affect your authentication or sending practices in any way.
4. The users who have access to that domain and the option to manage access
5. The alerts that are set up for that domain, with an option to add alerts
6. The EasyDMARC solutions and features that were activated for the domain or are yet to be activated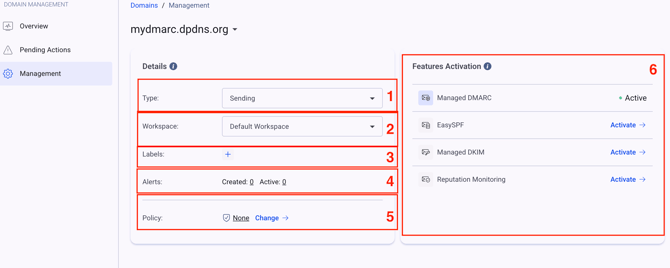
DNS manager
Now let's move on to the DNS Manager section. This is where you can view and manage the DNS health of your domains. It gives you a centralized look at each domain's DNS provider, health score, and any insights or issues detected, so you can catch problems before they affect your DMARC compliance or deliverability.
The DNS manager section consists of 4 tabs - Overview, Activity Log, Insights, and Monitoring.
1. Overview
Overview gives you a summary view across all your domains, including your total domain count, average health score, and how many insights (and critical insights) need your attention.
You will also find the search bar to search for any specific domain and the workspaces dropdown to select a specific workspace.
Down below the mentioned sections, you have the table of the domains, where by clicking on the domain, you will be redirected to the domain's DNS detailed view.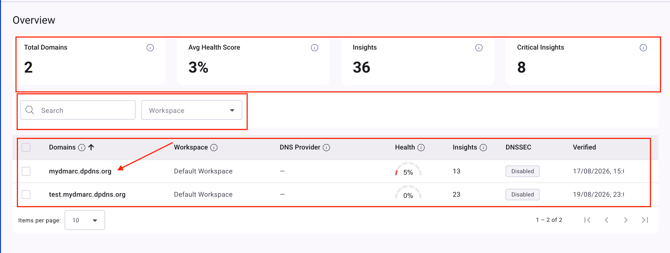
The detailed view will show the number of the domain's DNS records, the changes made to the records, DNS insights that you need to pay attention to.
Down below, you will find the DNS records of the domain and be able to check them without the need to navigate to the DNS zone. 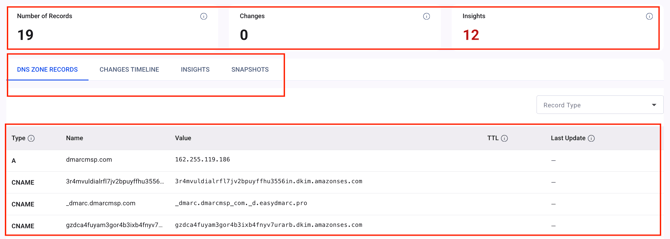
Activity log
This tab keeps a record of DNS-related changes and events for your domain's DNS records.
In this tab, you will find the filtering options with event type (record added, record removed, or record changed), workspaces, domains, and date.
You can also export the data in CSV, and below the filter, you will see the logs of the actual events that occurred for your domain. 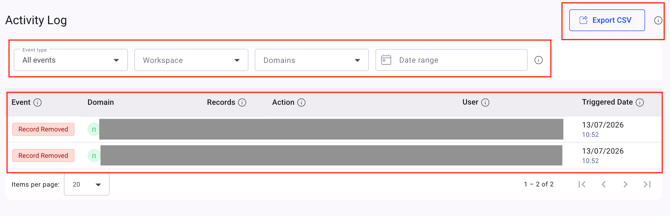
Insights
This section surfaces the specific DNS issues detected across your domains, so you can see what's wrong and where, rather than just knowing something needs attention.
The tab shows the total count of insights per their severity levels, the search bar, and the filtering option for the insights by their severity level.
Insight severities can be:
Critical: Issues that break or imminently threaten DNS resolution, email delivery, or domain security.
Warning: Misconfigurations that create risk or weaken security but don’t break anything immediately.
Informative: Best-practice nudges with no immediate risk.
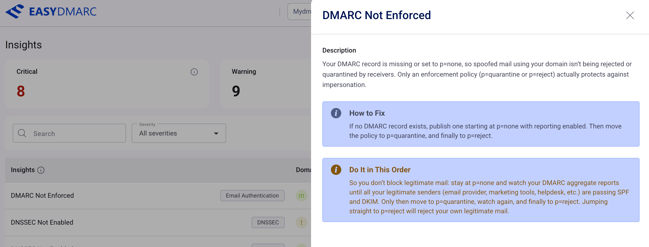
You can extend the detailed view of the insights to find the reason why a specific insight is important and how to fix any issues.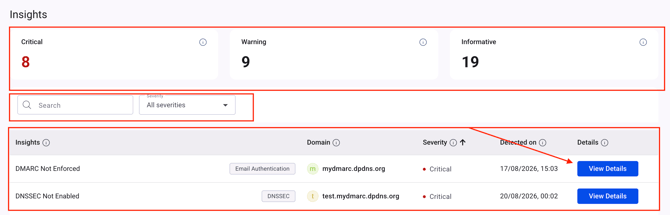
Monitoring
This tab tracks the ongoing status of your domains' DNS records.
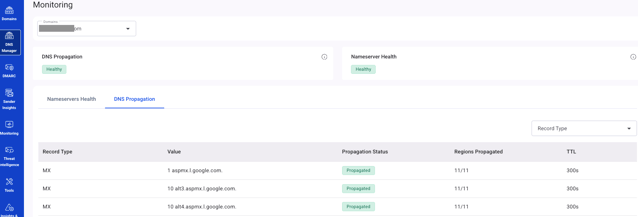
The Monitoring tab in DNS manager consists of the domains' dropdown, DNS propagation and Nameserver health statuses and corresponding sections to view and monitor the domain's Nameservers and the DNS propagation overall: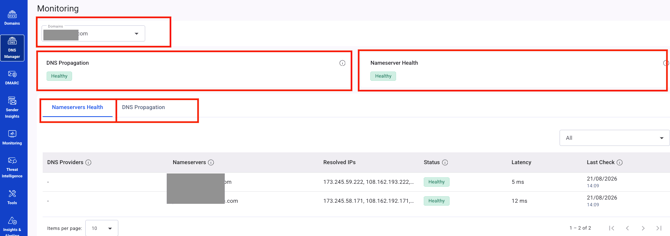
DMARC
The next main section in the EasyDMARC platform is the section DMARC, which consists of two main subsections - Reporting and Managed Solutions.
Reporting covers how you view and analyze your domains' DMARC aggregate and Failure reports, BIMI reporting and TLS reports.
1. Aggregate reports
Aggregate reports give a high-level summary of all messages sent from a domain, showing how many passed or failed DMARC, their delivery status (delivered, sent to spam, or rejected), sending IPs, and SPF/DKIM authentication and alignment results. These reports are generated every 24 hours.
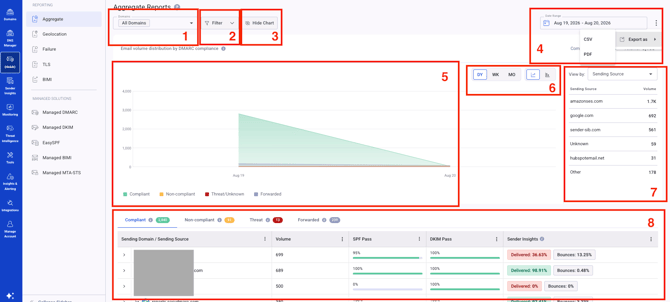
The section contains:
- A Domains dropdown to filter the data down to one or more specific domains
- A comprehensive filtering feature that lets you filter by any available criteria, and save your own custom filters as quick filters for future use
- A Hide Chart button, in case you want to hide the chart and focus only on the DMARC reports table
- A date range filter, along with the option to export the data as CSV or PDF
- A chart representing the data for the selected date range
- Options to view the data by day, week, or month, along with two different chart styles to choose from
- A data view option to sort the information by top volume — filterable by sending domain, sending source, or reporter
- DMARC aggregate reports in detail, parsed to human readable format for ease of monitoring
2. DMARC aggregate reports' geolocation view shows the map view of the IP locations from where your emails were sent: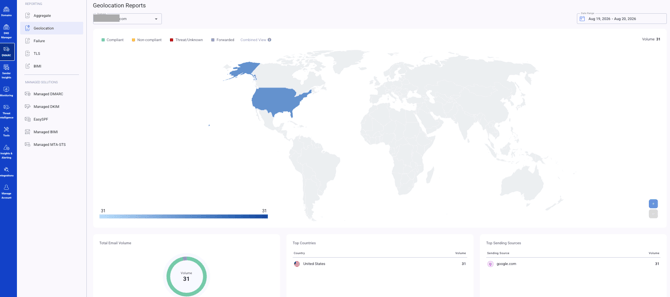
3. Failure reports
Failure reports provide detailed information about individual messages that failed DMARC, including headers and authentication results. These also include sensitive data such as the sender and recipient addresses, the subject line of the email, as well as the message headers. Failure reports are generated instantly when triggered.
Note: Since most ISPs don’t support failure reports due to privacy concerns, domain owners should mainly rely on aggregate reports for monitoring.
In the Failure Reports dashboard, you will find:
1. The domains dropdown to specify the domain(s) you want to view the reports for, and the filtering option to filter data per available criteria
2. Date range customization function
3. The top sending sources
4. The top receivers who are also the top DMARC failure report providers
5. The table of parsed DMARC failure reports 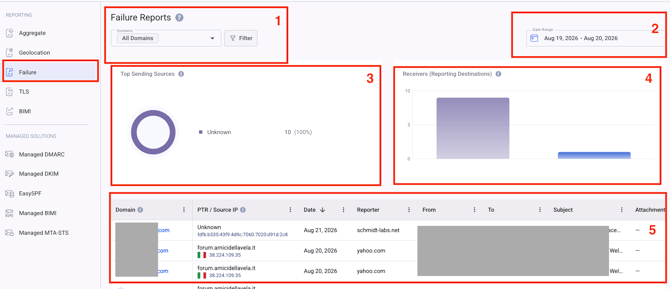
4. TLS reports
TLS reports show you whether other mail servers were able to establish a secure, encrypted connection when delivering email to your domain. 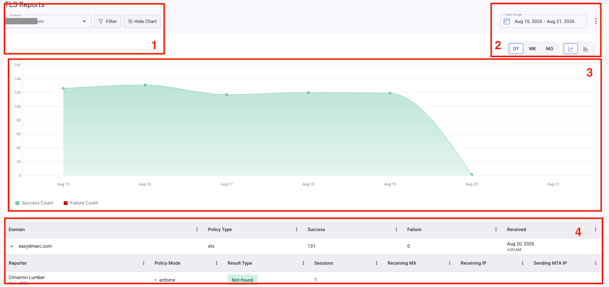
The section has the following parts:
1. Domain dropdown, filtering options with customizable filters so you're able to create your own quick filters, and the hide chart button in case you want to hide the chart and see only the TLS reports main details
2. Date range customization, the three dots which will open for you the CSV export option, and the view customization option per day, week, month as well as two chart styles
3. The chart visualizing your TLS reports per the selected date range
4. The TLS reports of the domain(s) received and parsed with details into human readable view
Note: You need to activate EasyDMARC's Managed MTA-STS and TLS-RPT solution to receive TLS reports in EasyDMARC.
5. BIMI reporting
BIMI reporting dashboard measures how their brand logo performs across email inboxes. BIMI Reporting shows where verified logos appear, how many recipients see them, and which providers deliver the most visibility.
The dashboard contains the following data points:
1. Domains dropdown to select the domain(s) you want to check the BIMI reports for
2. Date range customization feature
3. Brand impressions - Total number of times your brand's logo was potentially displayed to recipients
4. BIMI coverage - Percentage of your total sent emails where your BIMI logo potentially displayed to recipients. This indicates how many of your emails reached BIMI-enabled providers.
5. Top provider - The email provider that potentially displayed your BIMI logo most frequently, along with its percentage share of total brand impressions.
6. Email volume by provider type - Distribution of your email volume between providers that support BIMI logo display and those that don't. This helps you understand your potential reach for brand visibility.
7. Impression trend - Daily trend of logo impressions across all BIMI-supporting providers. Use this to track the growth and consistency of your brand visibility over time.
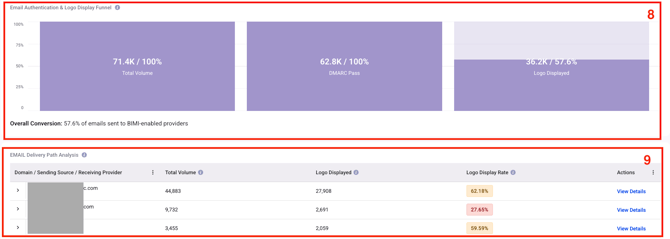
8. Email authentication and Logo display funnel - your email volume flow through each authentication stage — from total sent, through DMARC compliance, to final BIMI logo display.
9. Email delivery path analysis - Detailed view of email authentication and logo display performance for each sending domain and provider combination. A 100% display rate indicates perfect BIMI implementation for that path.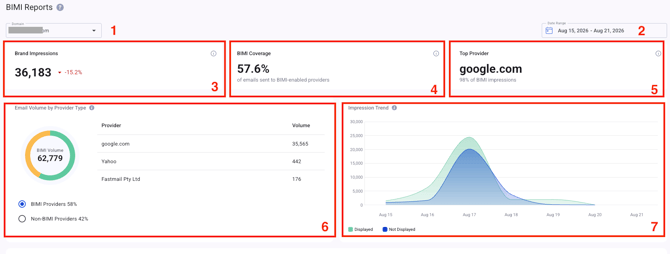
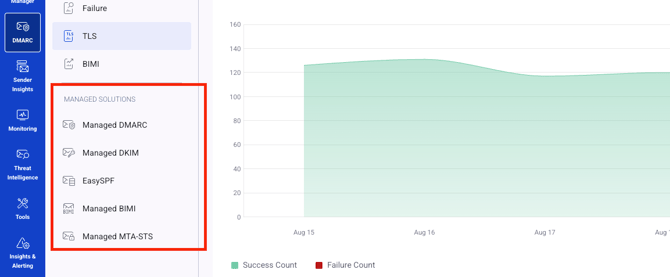
Managed Solutions let you handle DMARC, DKIM, SPF, BIMI, and MTA-STS management over to the platform instead of maintaining them manually in your DNS.
EasyDMARC provides 5 Managed solutions:
- Managed DMARC — lets you manage your DMARC policy directly from the platform, so moving from none to quarantine to reject is a setting you change in EasyDMARC rather than a DNS record you edit each time.
- Managed DKIM — handles your DKIM key management for you, including key rotation, without needing to touch your DNS zone manually.
- EasySPF — hosts and flattens your SPF record, solving the 10-DNS-lookup limit that breaks SPF for domains with many sending sources.
- Managed BIMI — Managed BIMI streamlines the deployment of BIMI, a protocol designed to enhance brand recognition.
- Managed MTA-STS - allows you to manage your MTA-STS settings from inside your EasyDMARC account as well, and you’ll be able to receive the TLS reports to the EasyDMARC dashboard and analyze them here.
Sender Insights
While the Sender Insights tab in the dashboards gives you a summary view, the main Sender Insights module is where you dig into the details. It shows how your email behaves after it leaves your systems, across every domain, sending tool, and mailstream you have connected.
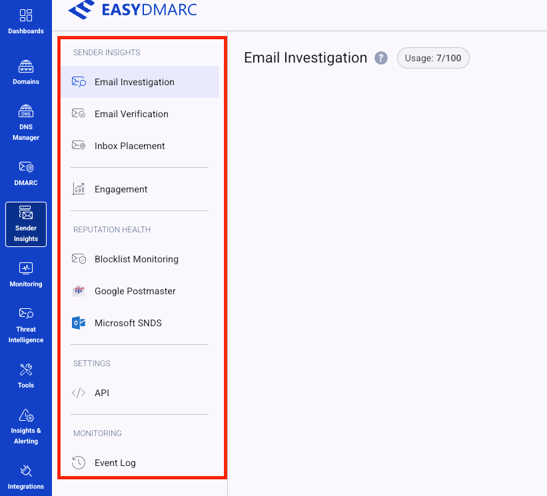
It's made up of six areas:
- Email Investigation
- Email Verification
- Inbox Placement
- Engagement
- Reputation Health
- APIs
- Event Logs
Note: Sender Insights isn't included by default with MSP subscriptions.
If you have an MSP subscription and are interested in Sender Insights, please contact your MSP growth manager or submit a ticket using this link.
Email investigation
Email Investigation lets you send or upload a test email and receive a full end-to-end analysis of how that message performs across the email delivery ecosystem. It helps you understand authentication, deliverability, spam classification, reputation, and message structure in a single structured report.
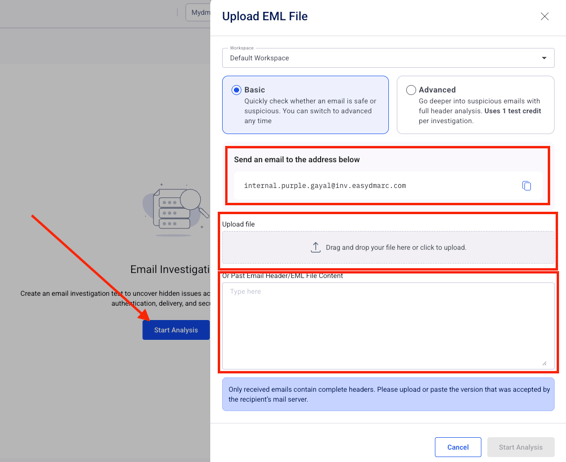
You simply need to click "Start analysis" and go with one of the following options:
1. Send an email from your domain to the provided email investigation address
2. Upload the original message header .eml file of one of your existing messages that was accepted by the recipient
3. Copy and paste the message header in the relevant field provided in the side panel
Once the analysis is completed, you will receive the full information on what happened to the email. 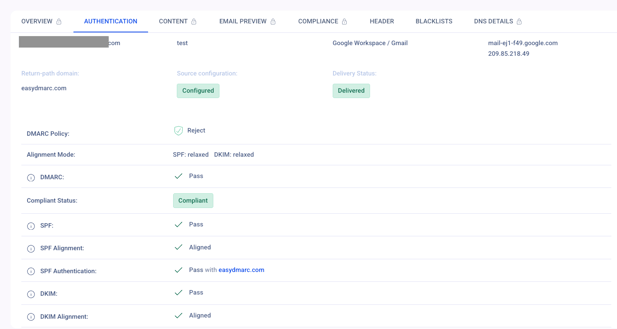
Note: Email investigation tool provides basic and advanced analytical options. Basic option doesn't take any credits and will provide you with your email results such as authentication, header details and blacklists information. To see other details, such as overview, content, email preview, compliance and DNS details, you should use the advanced investigation option which takes 1 credit per test.
Email verification
The Email Verification tool helps validate whether email addresses are safe and suitable for sending. Using advanced checks, it classifies each address as Deliverable, Risky, Undeliverable, or Unknown, helping you improve list quality, protect sender reputation, and reduce bounce rates.
You can perform the email verification tests in 4 options - single manual, single bulk, single API request and Bulk API request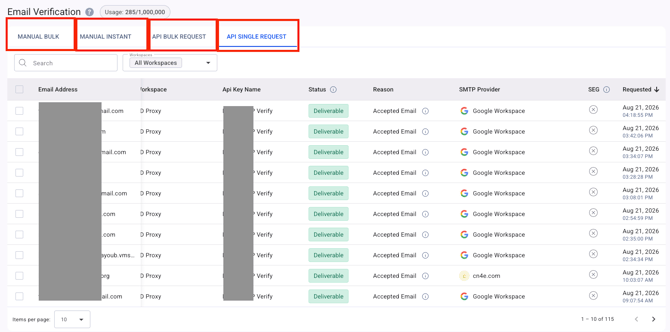
For more comprehensive information about the Email verification tool, please use the guide below:
Email verification tool explained
Inbox placement
Inbox Placement is a deliverability testing feature that shows where your emails land — Inbox, Spam, Promotions, or Missing — across different mailbox providers. It works by sending a test email from your domain to a set of predefined seed addresses and analyzing how each provider handles the message. This helps you evaluate your sending reputation and catch delivery issues before they affect real recipients.
To begin, create a test from the Inbox Placement section. Sender Insights supports two test types:
- Manual Test — a one-time test using a newly generated set of recipient addresses.
- Recurring Test — a reusable recipient list that lets you run the same test repeatedly without setting it up again each time.

Visit the Inbox placement detailed guide for more details on its logic and usage.
Engagement
This section applies to integrated Email Service Providers (ESPs) such as Amazon SES, HubSpot, MailChimp, and similar platforms. It provides a unified view of engagement and deliverability performance across all connected ESPs, making it easier to analyze email effectiveness in one centralized place.
Note: Visibility into this data requires at least one ESP integration connected to EasyDMARC. Multiple ESP accounts can be connected simultaneously, if needed.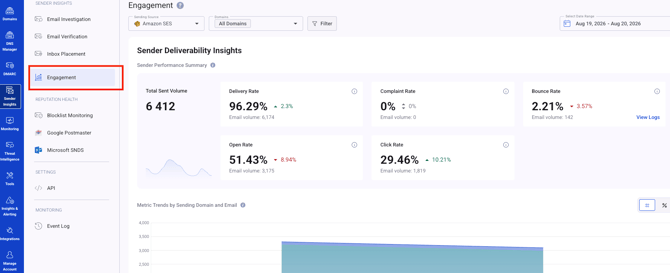
Check the following guide for comprehensive details about the Engagement module in Sender Insights:
Engagement in Sender Insights
Blocklist Monitoring
Blocklist Monitoring helps you automatically track whether your IP addresses or domains are blacklisted, giving you instant visibility into your current status so you can quickly take action and request delisting when needed. Direct links to vendor websites are also included to help you contact the relevant blocklist providers and protect your email deliverability.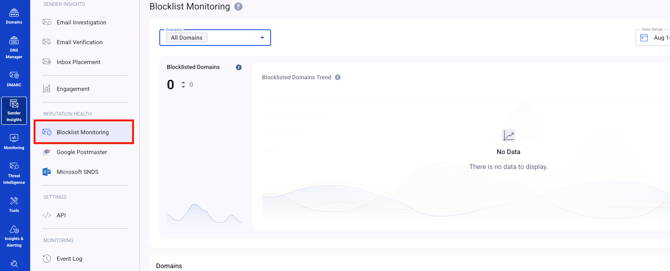
Check our Blocklist monitoring guide for more detailed overview about the section.
Google Postmaster in Sender Insights
Google Postmaster Tools gives you visibility into how Gmail evaluates your sending, including spam rate, reputation, authentication, and delivery errors, and since Gmail's read on your traffic is often a good proxy for how other mailbox providers see you too, it's a valuable signal even if Gmail isn't your primary audience. That's why it's available as an integration within Sender Insights: once connected, its dashboards feed directly into your Reputation Health view alongside your other sending data.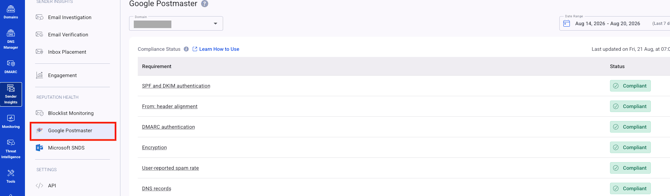
Please find the details on Google Postmaster integration and how to analyze its information in Sender Insights in the following articles:
Google Postmaster integration
Google Postmaster in Sender Insights
APIs
APIs can be used for email verification, which is the technical process of auditing an email list to ensure that addresses are valid, deliverable, and safe to contact. It acts as a gatekeeper, filtering out invalid entries such as typos, bots, and inactive accounts before an email campaign is sent.
Below is the guide on how to use email verification APIs in Sender Insights:
Email verification APIs
Event logs
The Event Logs module helps you understand sending behaviour, diagnose issues, and validate delivery outcomes by providing a centralized view of your email activity timeline. It captures key lifecycle events such as Sent, Delivered, Bounced, Opened, Clicked, Unsubscribed, and Complained, making it easy to see what happened, when it occurred, and which domains, email addresses, or sending sources were involved.
For more detailed information on Event logs in Sender insights, please check the guide below:
Event logs in Sender insights
Monitoring
The Monitoring module is built to monitor the uptime, SSL certificates and the VMC certificates.
Correspondingly, the module has three main sections:
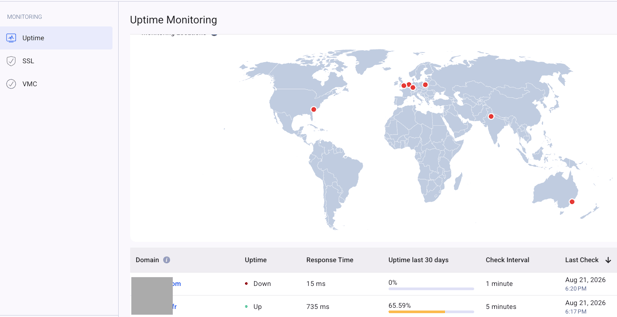
- Uptime Monitoring — checks whether your domains are reachable and responsive, tracking status, response time, and a rolling availability percentage so you can catch outages and slow infrastructure before they become bigger problems.
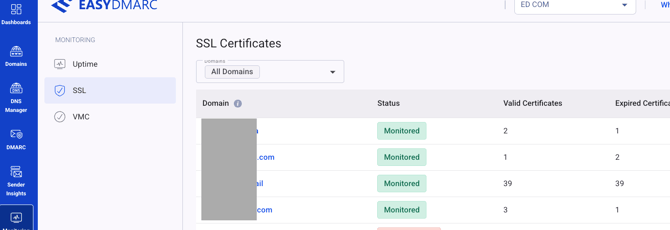
- SSL Monitoring — tracks the SSL certificate status across your domains, flagging which ones are valid, expiring soon, or missing a certificate entirely, so you can renew before a lapse causes a visible, customer-facing failure.
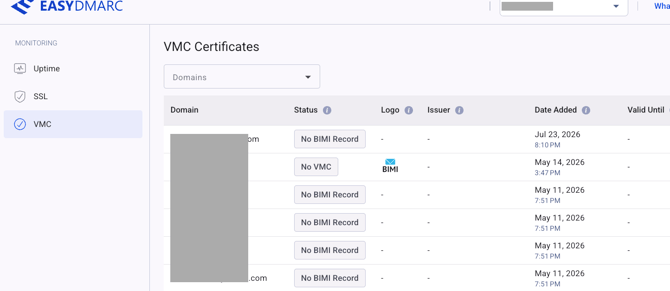
- VMC Monitoring — tracks your Verified Mark Certificates, the credentials that let your logo appear in supporting inboxes via BIMI, showing which domains have a valid VMC and which don't.
Tools
The Tools section is a set of standalone, self-service checkers and generators — unlike the rest of the platform, they aren't tied to a domain you've added and verified.
You can use them to quickly check or generate a record for any domain, even ones you don't manage in EasyDMARC.
It includes DMARC, SPF, DKIM, BIMI, Domain Scanner, Reputation Checker, SSL Checker, MTA-STS, TLS-RPT, DNS Checker, and Phishing URL Check.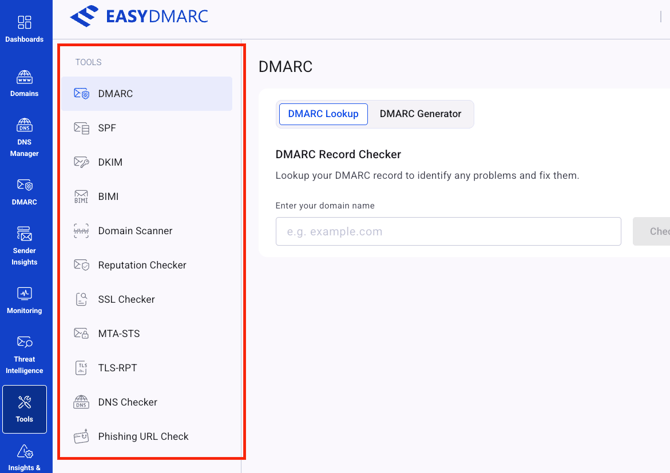
We hope this navigation guide provides proper understanding of the EasyDMARC platform, it's modules and features.
In case you have any questions which are not addressed the guide, please feel free to reach out to EasyDMARC experts.