
Uptime Monitoring
Uptime Monitoring helps you keep track of your domain's availability and performance by regularly checking it from multiple geographic locations. It allows you to see whether your domain is Up or Down, monitor response times, review uptime history, and identify incidents that may affect availability.
How Uptime Monitoring Works
Once a domain is added to your EasyDMARC account, it automatically appears in the Uptime Monitoring dashboard, where you can monitor its availability and performance from the configured monitoring locations.
The platform periodically checks the domain based on the configured monitoring settings. If the domain becomes unreachable, takes too long to respond, or returns an error, the event is recorded as an incident. Depending on your alerting configuration, you can also receive an alert when an issue is detected or when the domain recovers.
This allows you to quickly identify availability and performance issues and determine whether they are affecting a specific geographic location or multiple locations.
Getting Started
To access Uptime Monitoring:
- From the left-hand sidebar, navigate to Monitoring → Uptime.
- The Uptime Monitoring dashboard displays the domains available under your EasyDMARC account.
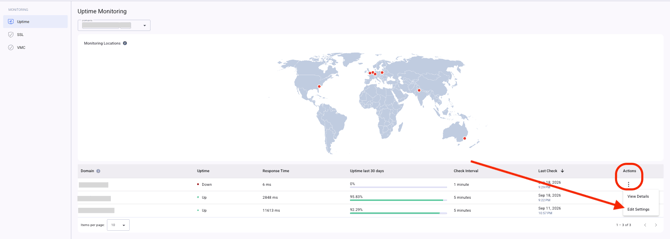
- To configure the monitoring settings for a domain, click the three-dot menu (Actions) next to the domain and select Edit Settings.
Monitoring Settings
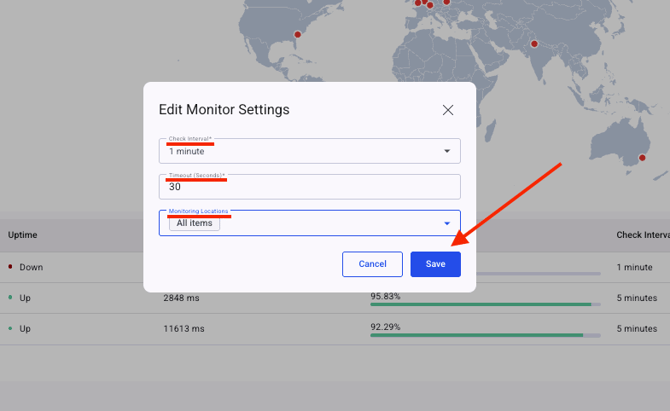
Each domain has its own monitoring settings, which you can adjust based on your monitoring requirements.
- Check Interval: determines how frequently the domain is checked. (The default interval is 5 minutes).
- Timeout: determines how long the monitoring check waits for a response before considering the check unsuccessful. (The default timeout is 10 seconds).
- Monitoring Locations: determine the geographic locations from which the domain is checked. Monitoring your domain from multiple locations allows you to see how it responds from different parts of the world. You can select the available monitoring locations when configuring the domain.
Note: You can update the monitoring settings for a domain at any time from Actions → Edit Settings.
Uptime Monitoring Dashboard
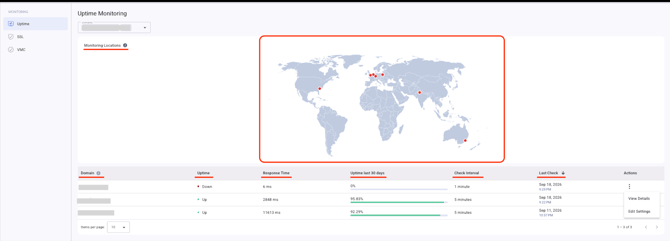
The main Uptime page provides an overview of all domains currently being monitored.
The page includes:
- Monitoring Locations (on map)
- Domain
- Uptime
- Response Time
- Uptime for the last 30 days
- Check Interval
- Last Check
- Actions
The monitoring locations map provides a visual representation of the locations used to monitor your domains.
The domain table allows you to quickly identify the current status and performance of each monitored domain.
Domain Status:
The Uptime column indicates the current status of the monitored domain.
- Up: The domain is reachable and responding as expected.
- Down: The domain is unreachable or returning an error.
- Paused: Monitoring is temporarily paused for the domain.
Domain Details
To view more detailed information about a domain, click the domain name from the Uptime Monitoring table.
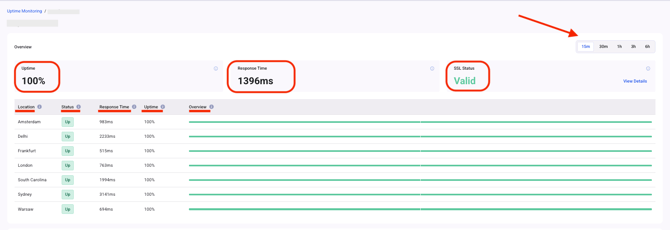
The domain details page provides a more detailed view of the domain's availability and performance across the selected monitoring locations.
Overview
At the top of the page, you can see key metrics for the selected time range:
- Uptime: The percentage of time the domain was reachable.
- Response Time: The average response time across the active monitoring locations.
- SSL Status: The current status of the domain's SSL certificate, with an option to view additional certificate details.
Note: You can change the displayed time range using the selector in the upper-right corner. Available ranges include 15 minutes, 30 minutes, 1 hour, 3 hours, 6 hours.
Monitoring Location Status:
The location table provides information about the domain's performance from each monitoring location.
For each location, you can see:
- Location: The geographic monitoring location.
- Status: The current status of the domain from that location.
- Response Time: The latest response time recorded from that location.
- Uptime: The uptime percentage for the selected time range.
- Overview: A timeline showing the results of individual monitoring checks.
The timeline is color-coded to help you identify periods when the domain was available or experienced issues.
Response Time:
The Response Time chart shows how the domain's response time has changed during the selected time range.
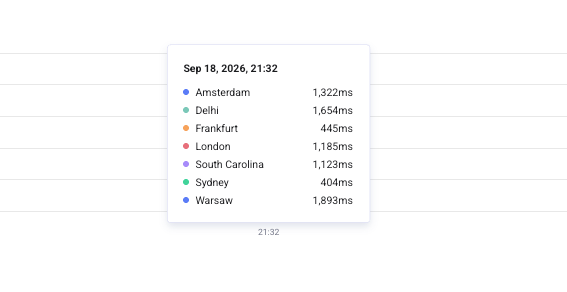
Each monitoring location is represented separately, allowing you to compare response times across locations.
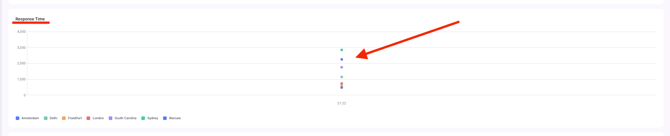
Hover over a point on the chart to view the corresponding timestamp and response time for the selected location.
Recent Incidents:
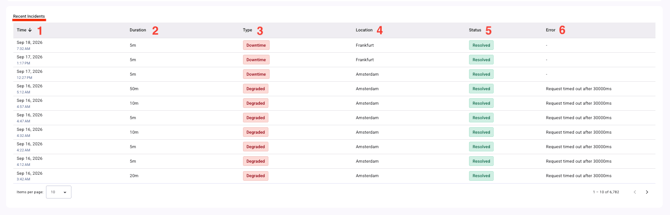
The Recent Incidents section provides a history of availability or performance issues detected during monitoring.
Each incident includes:
- Time: When the incident was first detected.
- Duration: How long the incident lasted, or whether it is still ongoing.
- Type: The type of incident detected.
- Location: The monitoring location that detected the issue.
- Status: Whether the incident is ongoing or has been resolved.
- Error: Additional error information associated with the incident, when available.
For example, an incident may indicate that a request timed out or that the monitored domain returned an HTTP error.
Reviewing recent incidents can help you identify recurring availability or performance issues and determine whether they are isolated to a particular monitoring location.
Uptime Monitoring provides a clear overview of your domains' availability and performance from multiple geographic locations. By monitoring uptime, response times, and recent incidents, you can quickly identify potential issues and stay informed about your domain's availability.