
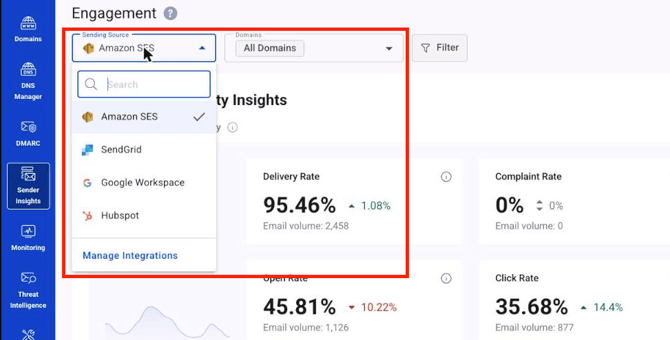
This section applies to your integrated Email Service Providers (ESPs) as well as to Mailbox Providers(MBPs), such as Amazon SES, SendGrid, Google Workspace, and HubSpot.
It gives you one unified view of engagement and deliverability performance per ESP/MBP, so you're not jumping between each provider's own dashboard.
You'll find it under Sender Insights → Engagement.
Important: what you see on this page depends entirely on which Sending Source is selected.
Not every ESP tracks the same things, so both the summary cards and the table columns adapt to what that source can actually report:
| Sending Source | Sender Performance Summary cards | Table columns |
|---|---|---|
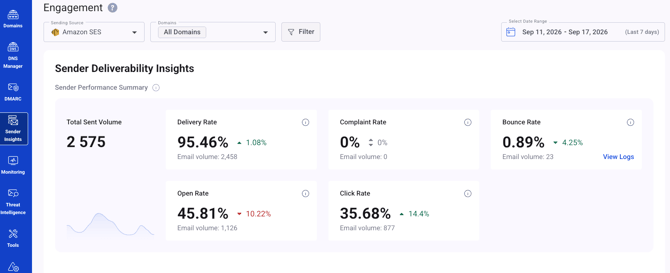
| Amazon SES | Total Sent Volume, Delivery Rate, Complaint Rate, Bounce Rate, Open Rate, Click Rate (6) | Full: Sent, Delivered, Opens, Clicks, Complaints, Bounces |
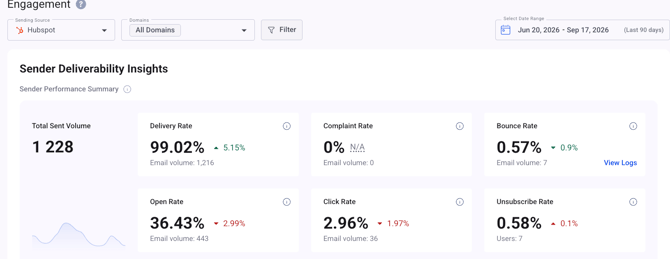
| SendGrid / HubSpot | Same 6, plus Unsubscribe Rate (7) | Full |
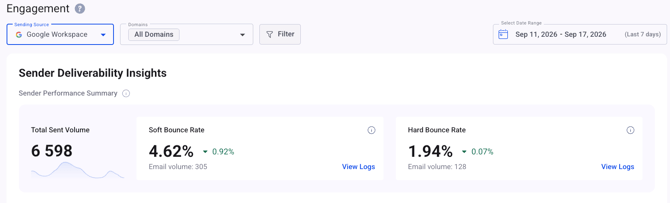
| Google Workspace | Only Total Sent Volume, Soft Bounce Rate, Hard Bounce Rate (3) — bounce is split into two cards instead of one, each with its own View Logs | Reduced everywhere to just Sent, Soft Bounce, Hard Bounce |
Header
- Sending Source — Amazon SES, SendGrid, Google Workspace, or HubSpot, with a Manage Integrations shortcut at the bottom
- Domains — multi-select, searchable, grouped by workspace
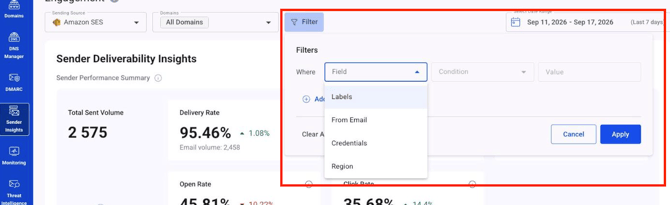
- Filter — Field options here are Labels, From Email, Credentials, or Region
- Select Date Range — presets or custom range
Sender Performance Summary
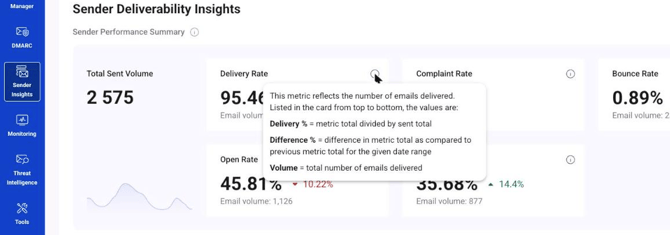
Each card follows the same three-part pattern: the rate (metric ÷ sent or delivered total), the difference % (vs. the previous period — shown as a flat "⇕" icon when there's no change, or a colored ▲/▼ when there is), and email volume (the raw count). Hovering the ⓘ spells this out exactly for that metric.
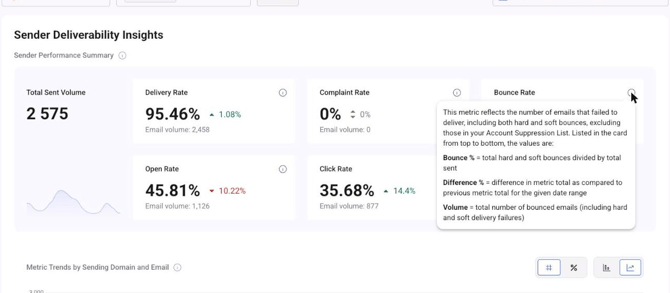
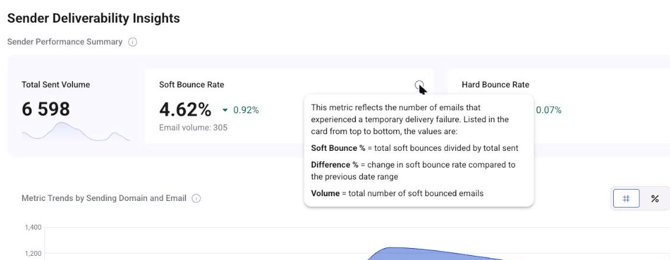
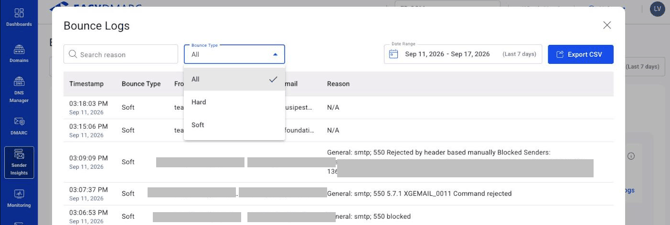
Clicking View Logs on any Bounce card opens a Bounce Logs window: searchable by reason, filterable by Bounce Type (All/Hard/Soft), its own date range, and CSV export. It loads more rows as you scroll rather than paginating.
Bounce logs view: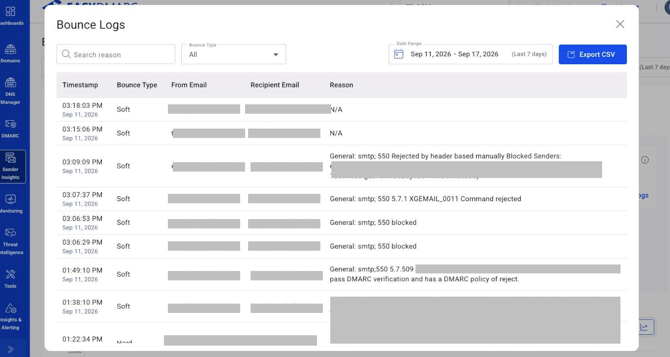
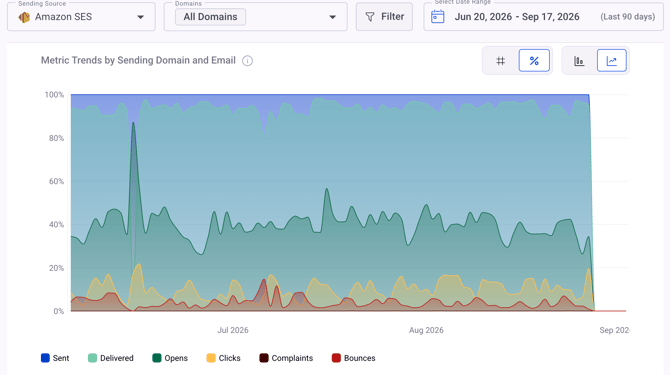
Metric Trends by Sending Domain and Email
A bar/trend chart-type toggle and a #/% toggle, tracking Sent, Delivered, Opens, Clicks, Complaints, and Bounces over the date range.
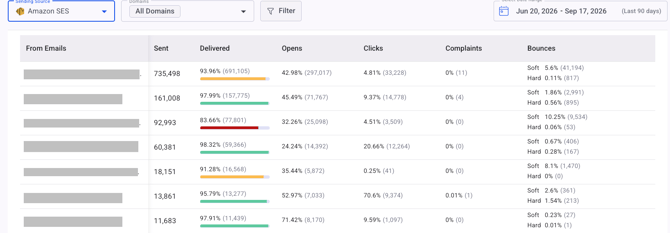
Detailed Metrics by Sending Emails
Per-from-address breakdown (Sent, Delivered, Opens, Clicks, Complaints, Bounces split Soft/Hard — or just Sent/Soft/Hard on Google Workspace), with a Total row and pagination (Items per page: 10/20/50/100). Rows aren't clickable — there's no drill-down drawer here, and columns aren't sortable.
Recipient Deliverability Insights
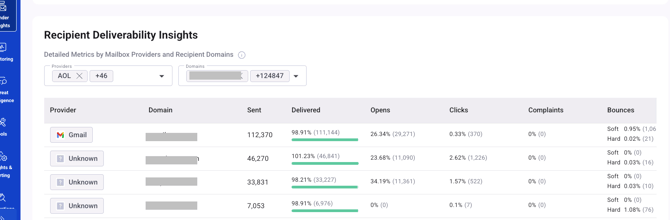
Detailed Metrics by Mailbox Providers and Recipient Domains — the same metrics, segmented by mailbox provider (Gmail, Office 365, Google Workspace, or "Unknown") and recipient domain, with its own Providers and Domains multi-select filters.
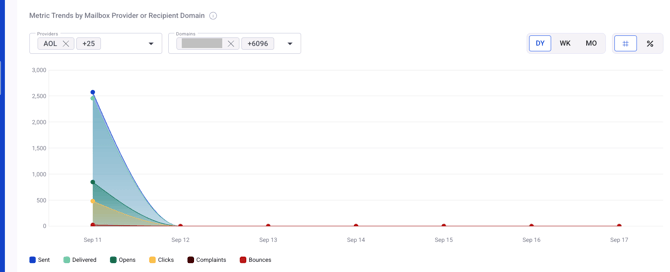
Metric Trends by Mailbox Provider or Recipient Domain — same Providers/Domains filters, plus a DY / WK / MO granularity toggle and #/%.
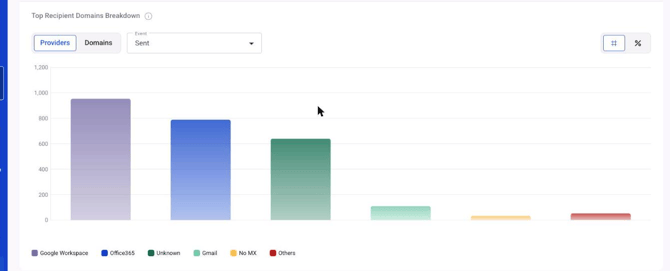
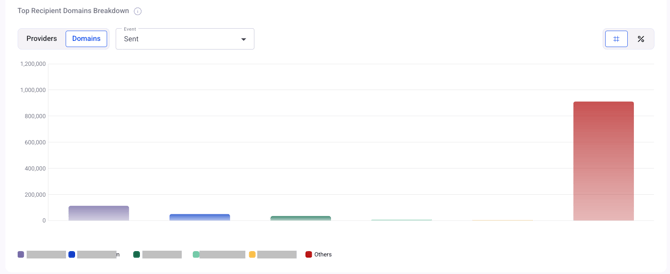
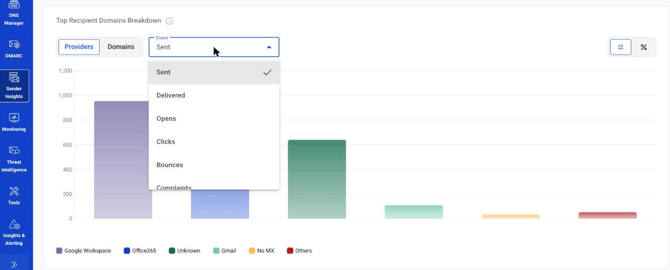
Top Recipient Domains Breakdown — a Providers/Domains toggle for the bar chart, an Event dropdown (Sent, Delivered, Opens, Clicks, Bounces, Complaints), and #/%.
If you have any questions not addressed in this guide, feel free to reach out to EasyDMARC experts.